Utilities around the emulator: from the simplest possible 6502 assembler to the inspector of the gate-level core and the players of the PPU/APU register dumps.
This page describes the programs in the Tools/ folder of the repository: the assembler
Breakasm, which the debugger uses to assemble the entered source; the
Breaks Debugger, a GUI for checking the 6502 core; the replay tools
PPU Player and APU Player; the speed profiling demos
PpuPumpkin and ApuPumpkin; the audio playback utility
Slooow Plaaayer; and the demo programs SignalPlotDemo and
InfernoColormap for the custom WinForms controls.
Breakasm

As simple and dumb assembler as possible, to generate code.
To run:
Breakasm [-l <file.lst>] <source.asm> <output.prg>
Example: Breakasm -l test.lst test.asm test.prg
The -l <file.lst> option writes an assembly listing (address, emitted bytes and the source line) to the given file.
There is also a Python port with the same behaviour and command line:
python breakasm.py [-l <file.lst>] <source.asm> <output.prg>PRG file is always 64 Kbytes (the size of 6502 address space). The current assembly pointer (ORG) can be set anywhere in the PRG.
Syntax
The source text is split into lines of the following format:
[LABEL:] COMMAND [OPERAND1, OPERAND2, OPERAND3] ; CommentsThe label (LABEL) is optional. The command (COMMAND) contains 6502 instruction or one of the assebmler directives. The operands depend on the command.
Expressions
All operands are evaluated with the built-in expression engine. Labels, defines and complex expressions are supported in every operand position:
LDA     MyData + 32 * entry_size + 12
STA     (Base << 4) | 1
BYTE    Table + 2
Supported operations (from high to low priority):
()      grouping
! ~     logical not, bitwise not (unary)
* / %   multiply, divide, modulo
+ -     add, subtract
<< >>   shift left, shift right
<<< >>> rotate left, rotate right
> >= < <=  comparisons (result: 0 or 1)
== !=   equality (result: 0 or 1)
& | ^   bitwise and, or, xor
Numbers can be decimal (12), hexadecimal ($12, #$12) or binary via defines. An immediate operand starts with # (LDA #5). A whole operand wrapped in parentheses is indirect addressing (JMP (addr)), while parentheses inside an expression are grouping only.
Multi-pass assembling
Breakasm assembles the source in several passes until all identifiers, labels and defines are resolved. This also resolves the Zero Page / Absolute ambiguity: if a forward-referenced label turns out to be below $100, the assembler automatically uses the shorter zero page opcode (unless the ABS directive forces the absolute one).
Embedded Directives
| Directive | Description |
|---|---|
| ORG | Set the current PRG assembly position. |
| INCLUDE | Process a nested source file |
| DEFINE | Define a simple constant |
| BYTE | Output a byte or string |
| WORD | Output uint16_t in little-endian order. You can use both numbers as well as labels and addresses. |
| END | Finish the assembling |
| PROCESSOR | Defines type of processor for informational purposes |
| ABS | Hint: the next instruction with a Zero Page / Absolute ambiguity (address below $100) must use the absolute opcode |
Example of the ABS directive:
        ABS
        LDA     $10         ; uses AD 10 00 (absolute), not A5 10 (zero page)
        LDA     $20         ; the hint is consumed by the previous instruction: A5 20 (zero page)
Example Source Code
Not to write too much, I will just show you an example of the source code. Do it the same way and it should work.
; Test program

LABEL1:

    PROCESSOR 6502
;    ORG     $100

    DEFINE  KONST   #5

    LDX     KONST

AGAIN:
    NOP
    LDA     SOMEDATA, X         ; Load some data
    JSR     ADDSOME             ; Call sub
    STA     $12, X
    CLC
    BCC     AGAIN               ; Test branch logic

ADDSOME:                        ; Test ALU
    ADC     KONST
    PHP                         ; Test flags in/out
    PLP
    RTS

    ASL     A

SOMEDATA:
    BYTE    12, $FF, "Hello, world"
    WORD    AGAIN

END
Support for NES and mappers
Dragging some NES and mapper prisserans into a generalized assembler is a bad idea.
Build multiple PRG files and compile a .nes file from them yourself if you need to.
Breaks Debugger

A simple GUI for checking the operation of the 6502 Core component (M6502Core).
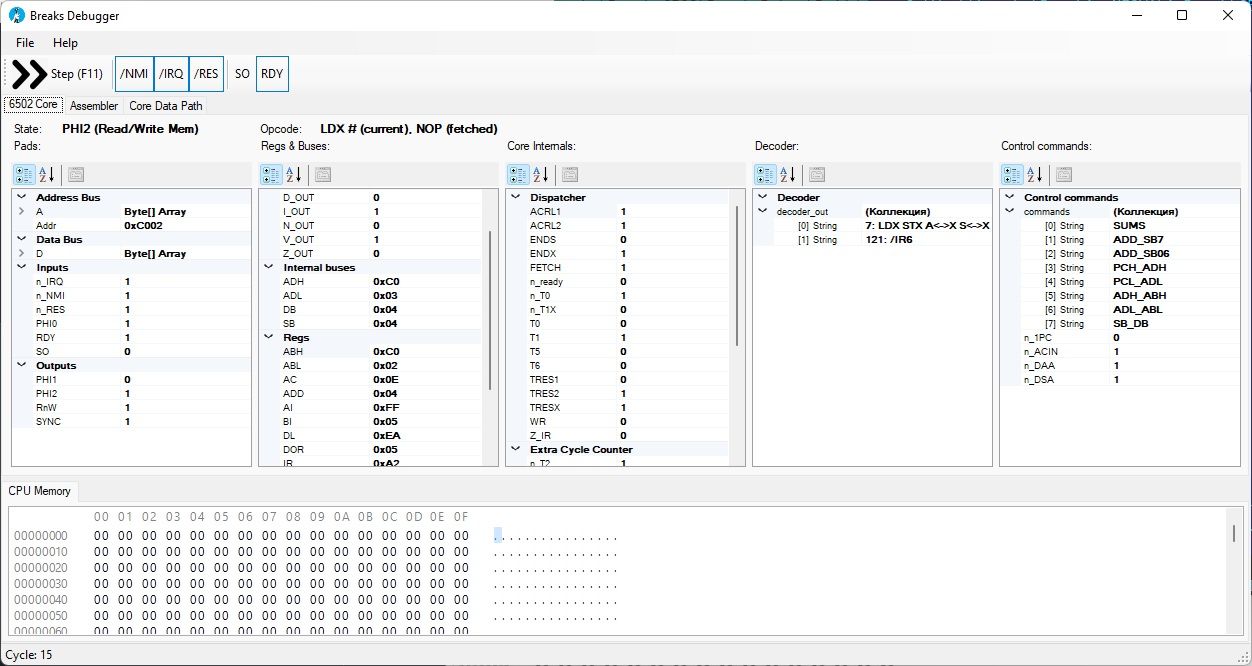
The PropertyGrids shows signals, registers and rest of DebugInfo of the 6502 core. Buttons above are manual control of the respective pins. The CPU Memory tab displays the HexDump of the memory. The Assembler tab shows a TextBox with the source, which will be assembled with the built-in Breakasm and loaded immediately into memory.
Breakasm and M6502Core are in their respective Interop DLLs.
Build
You must use Debug/Release x86/x64 configuration to build. AnyCPU is not suitable because it uses native code in Interop DLLs.
Just don't forget to switch back to Any CPU when you need to edit forms. Microsoft has a problem with this.
It is also necessary to install all packages using NuGet (see packages.config).
Processor State Dump for Wiki
To enable a detailed dump of all internals directly in Markdown and with pictures, you need to create the WikiMarkdown folder.
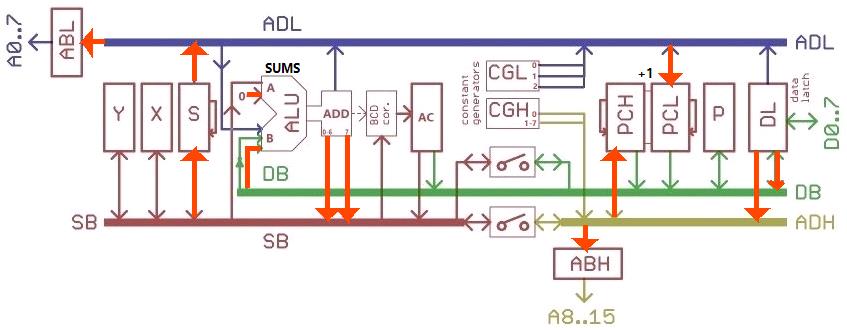
The state of the processor will be dumped every half-cycle. The dump will include the state of the internals as a Markdown table and a picture of what is going on at the bottom of the processor (connecting registers and internal buses).
About that:
JSR (0x20), T1 (PHI1)
| Component/Signal | State |
|---|---|
| Dispatcher | T0: 0, /T0: 1, /T1X: 0, 0/IR: 1, FETCH: 0, /ready: 0, WR: 0, ACRL1: 0, ACRL2: 1, T5: 0, T6: 0, ENDS: 1, ENDX: 1, TRES1: 1, TRESX: 0 |
| Interrupts | /NMIP: 1, /IRQP: 1, RESP: 0, BRK6E: 0, BRK7: 1, DORES: 0, /DONMI: 1 |
| Extra Cycle Counter | T1: 1, TRES2: 1, /T2: 1, /T3: 1, /T4: 1, /T5: 1 |
| Decoder | 95: JSR (TX), 121: /IR6, 126: /IR7 |
| Commands | S_ADL, SB_S, DB_ADD, Z_ADD, SUMS, ADD_SB7, ADD_SB06, ADH_PCH, ADL_PCL, ADH_ABH, ADL_ABL, DL_ADH, DL_DB |
| ALU Carry In | 0 |
| DAA | 0 |
| DSA | 0 |
| Increment PC | 1 |
| Regs | |
| IR | 0x20 |
| PD | 0x00 |
| Y | 0x00 |
| X | 0x05 |
| S | 0x0E |
| AI | 0x00 |
| BI | 0xC0 |
| ADD | 0xFB |
| AC | 0x6C |
| PCL | 0x09 |
| PCH | 0xC0 |
| ABL | 0x0E |
| ABH | 0xC0 |
| DL | 0xC0 |
| DOR | 0xC0 |
| Flags | C: 1, Z: 0, I: 1, D: 0, B: 1, V: 0, N: 0 |
| Buses | |
| SB | 0xFB |
| DB | 0xC0 |
| ADL | 0x0E |
| ADH | 0xC0 |
UnitTest
To run the debugger in unit test mode, you need to create a JSON like this:
{
	"CompileFromSource": true,
	"MemDumpInput": "mem.bin",
	"AsmSource": "Test.asm",
	"RunUntilBrk": true,
	"RunCycleAmount": true,
	"CycleMax": 10000,
	"RunUntilPC": true,
	"PC": "0x3469",
	"TraceMemOps": false,
	"TraceCLK": true,
	"DumpMem": true,
	"JsonResult": "res.json",
	"MemDumpOutput": "mem2.bin"
}
And run with parameter: BreaksDebugger Test.json.
As input code, you can use 64 Kbytes memory dump (MemDumpInput) or assembly language source (AsmSource).
Simulator will run until it encounters instruction BRK (RunUntilBrk) or specified number of cycles (RunCycleAmount, CycleMax) (These are cycles, not half-cycles).
The output will be a memory dump after simulation (MemDumpOutput) and JSON with simulation results (JsonResult).
PPU Player
Workflow:
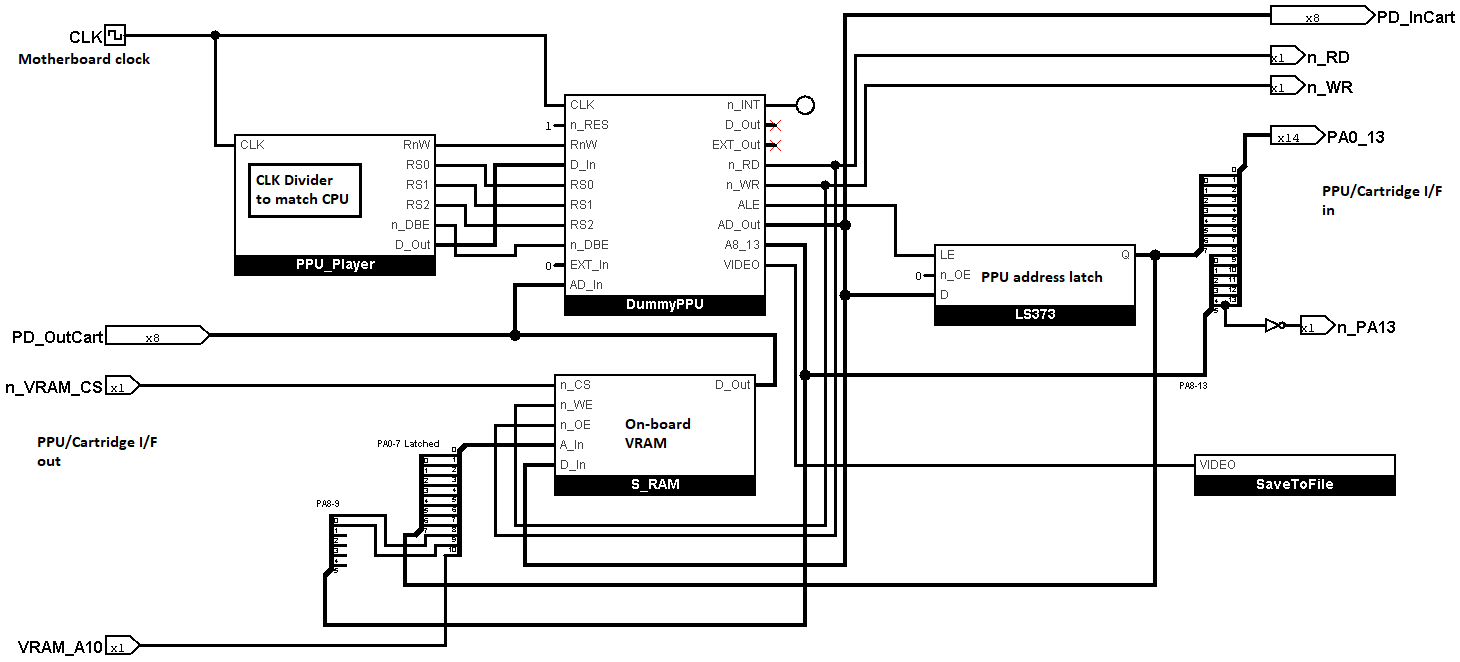
How to get PPU register dumps
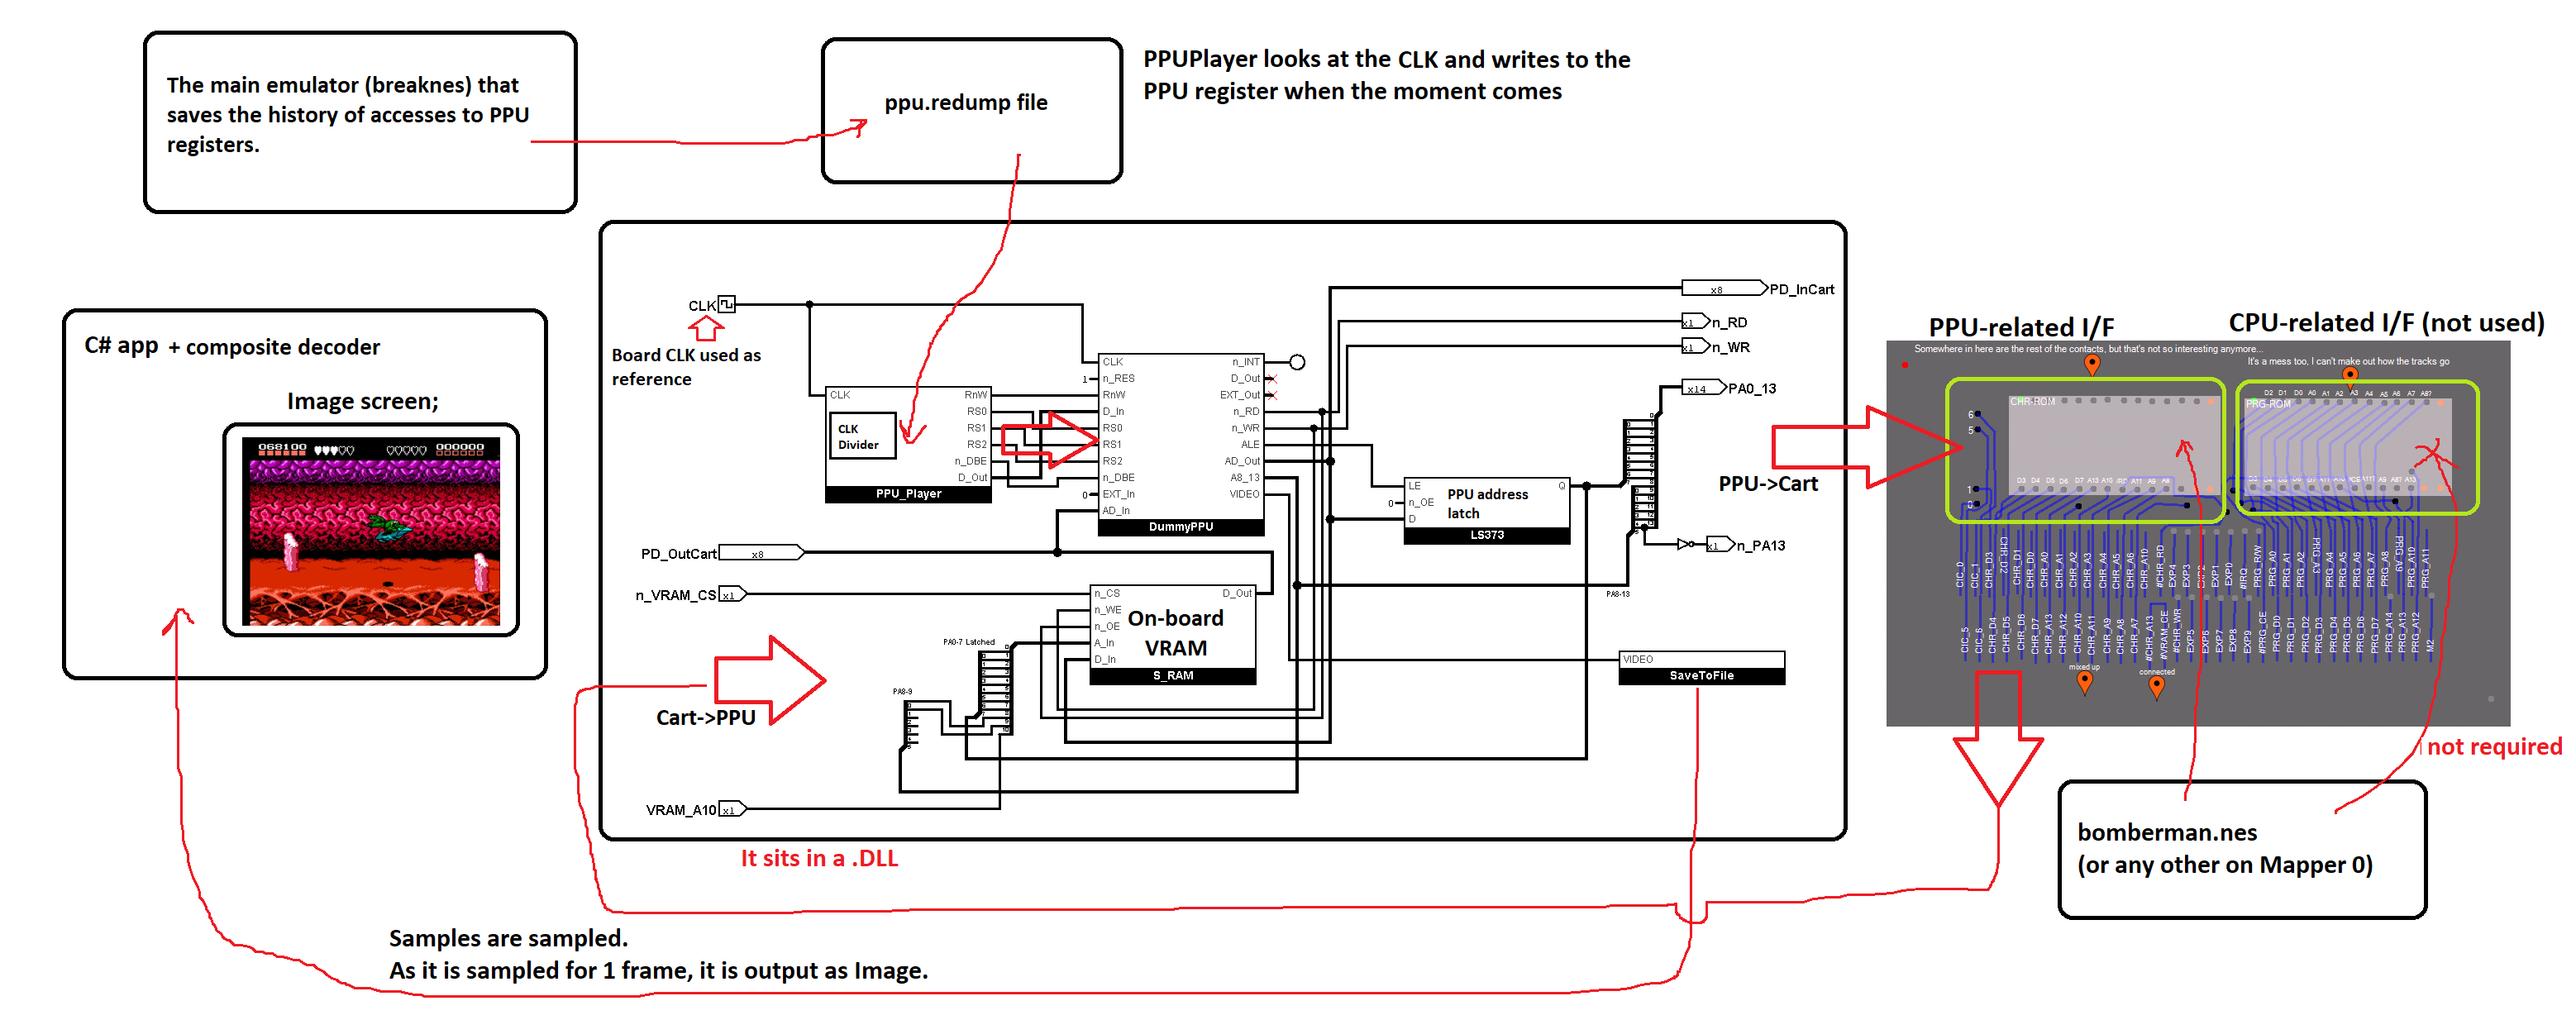
You can use the main emulator (breaknes). In the settings you need to enable PPURegump=True and select the folder where regdump will be saved.
Don't forget to set the correct CPU divider in the PPUPlayer settings to match the CPU with which the regdump was obtained.
Regdump entries format:
#pragma pack(push, 1)
struct RegDumpEntry
{
	uint32_t	clkDelta;	// Delta of previous CLK counter (CPU Core clock cycles) value at the time of accessing to the register
	uint8_t 	reg; 		// Register index + Flag (msb - 0: write, 1: read)
	uint8_t 	value;		// Written value. Not used for reading.
	uint16_t	padding;	// Not used (yet?)
};
#pragma pack(pop)
CPU I/F Timing
This section describes when (and for how long) to use the CPU I/F to read/write the PPU register.
No 6502 load/store instruction can technically execute faster than a single PCLK.
So we will make the assumption that the CPU I/F (signal /DBE and others) will be active for the entire PCLK cycle (/PCLK + PCLK).
If this does not work, we will do some more research on how to do it better.
EDIT: This model works if you use a correct regdump that writes to PPU registers correctly. If you write to PPU registers at the wrong moment (e.g. not during VBlank), visual artifacts may appear.
APU Player
About image by u/ThatPixelArtDude.
How to get APU register dumps
You can use the main emulator (breaknes). In the settings you need to enable APURegump=True and select the folder where regdump will be saved.
Regdump entries format:
#pragma pack(push, 1)
struct RegDumpEntry
{
	uint32_t	clkDelta;	// Delta of previous CLK counter (CPU Core clock cycles) value at the time of accessing to the register
	uint8_t 	reg; 		// Register index + Flag (msb - 0: write, 1: read)
	uint8_t 	value;		// Written value. Not used for reading.
	uint16_t	padding;	// Not used (yet?)
};
#pragma pack(pop)
PpuPumpkin
A demo for profiling the speed of PPUSim in order to optimize it.
PPU executed 21477272 cycles in real 20375 msec
You're 20.38 times slower :(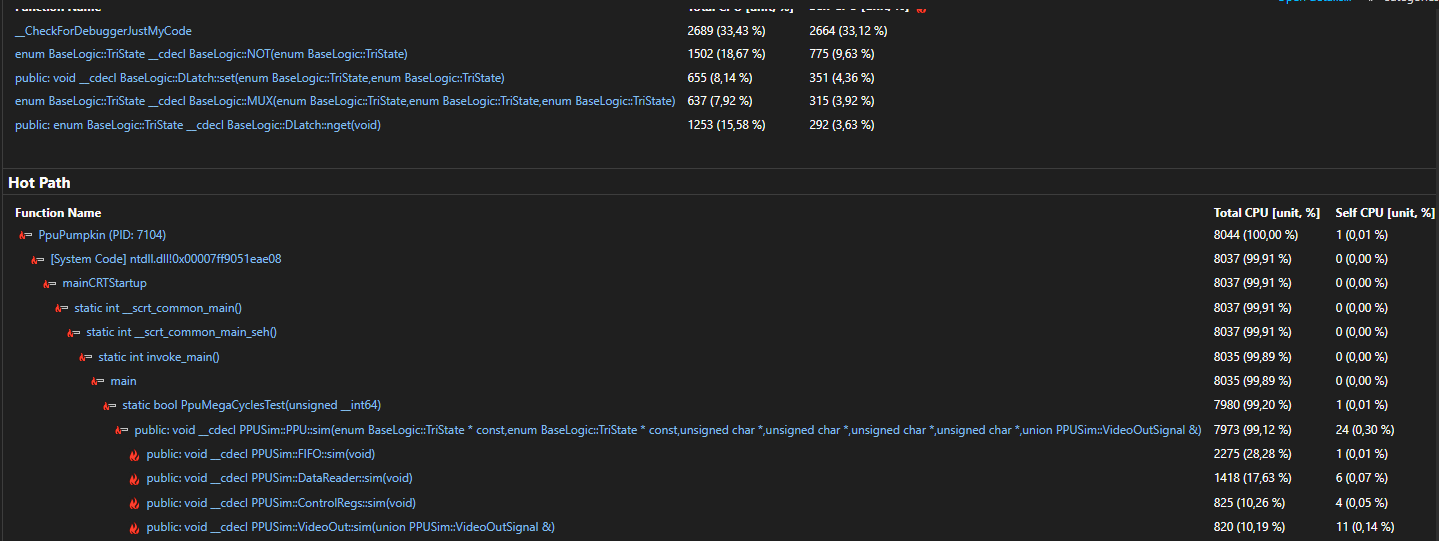
ApuPumpkin
A demo for profiling the speed of APUSim in order to optimize it.
APU+Core executed 21477272 cycles in real 63266 msec
You're 63.27 times slower :(
Slooow Plaaayer
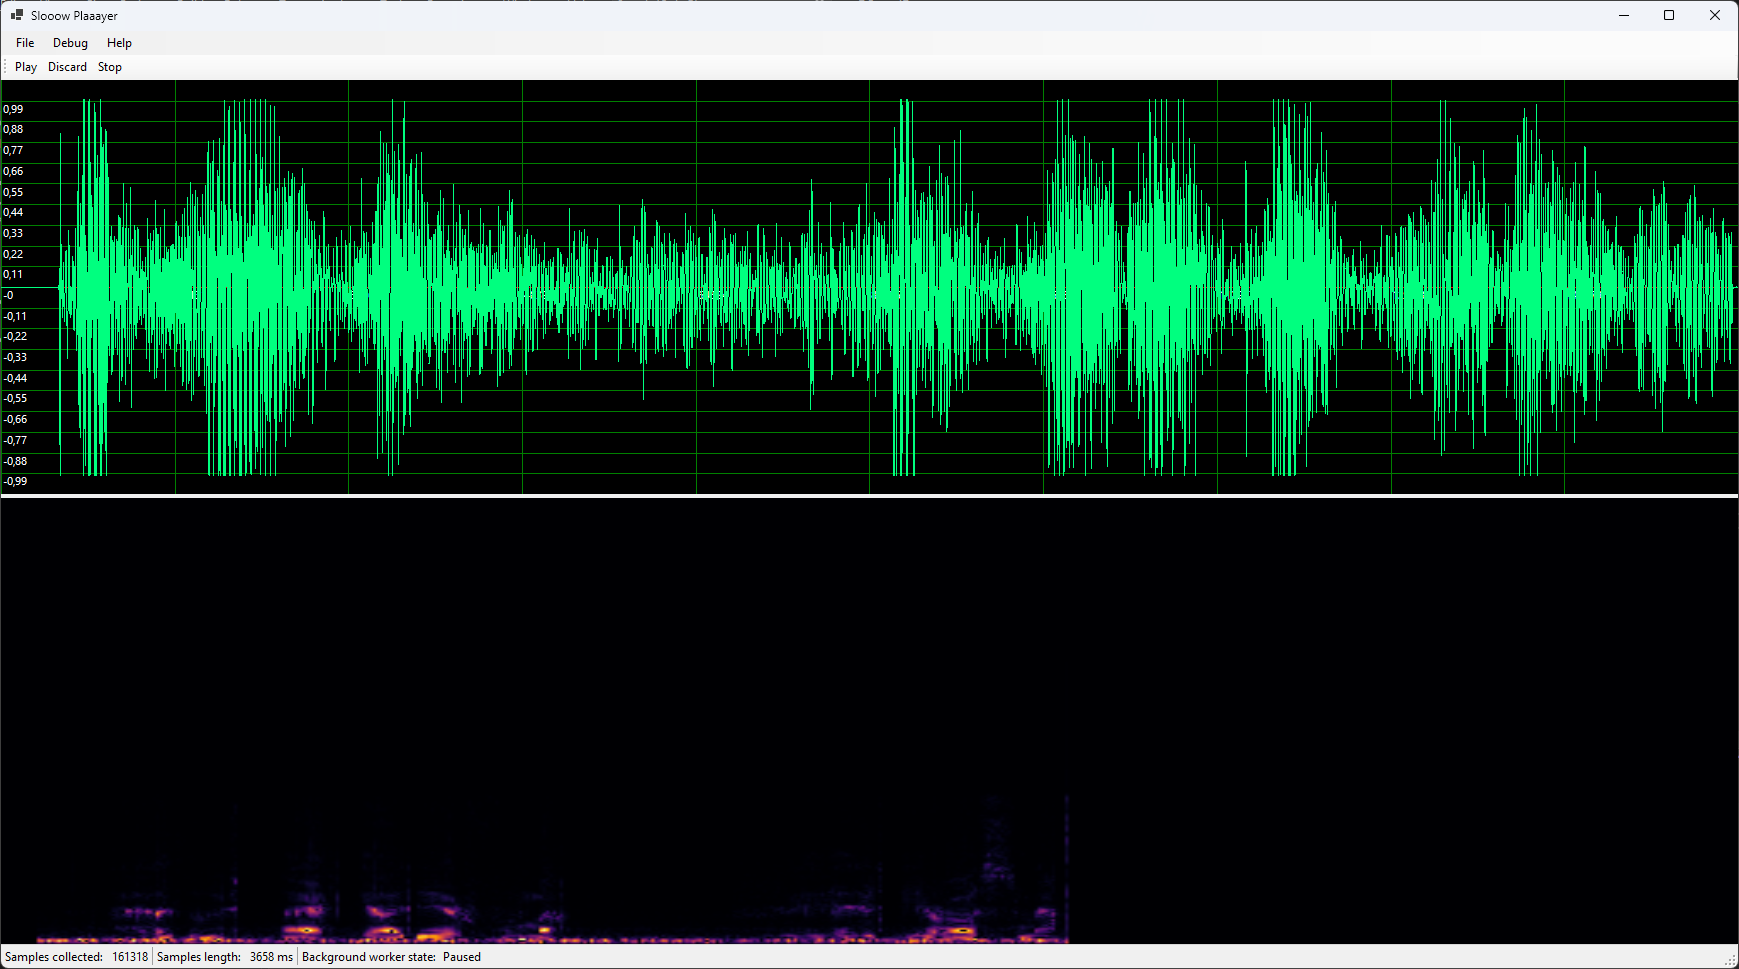
Utility for playing audio samples that were obtained from a slow source (such as APUSim).
Sample sources:
- Debug vibrato sound (Debug menu)
- Data from a .wav file
Principle of operation
The Background Worker runs in the background and collects samples from the source (SourceSamples) into an intermediate buffer (SampleBuf) with a slight delay.
Once every (real) second, statistics are updated and a signal graph is plotted.
If the source samples run out, the worker falls asleep until it gets a new source.
SignalPlotDemo
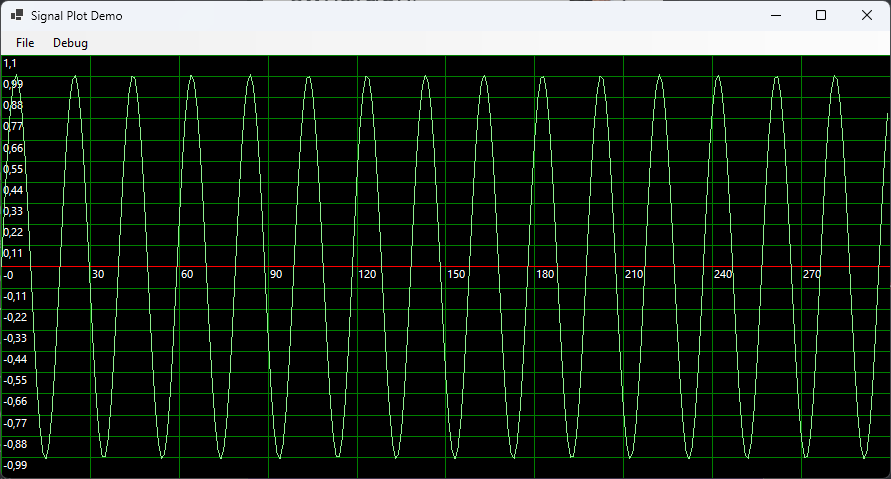
Demonstration of the custom WinForms SignalPlotControl.
In the menu you can select two types of signals: normalized noise and sine wave (kinda).
InfernoColormap
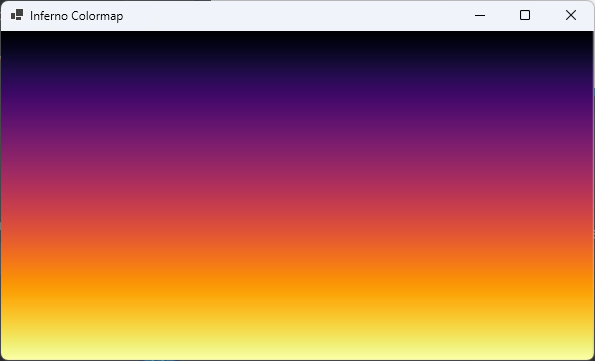
Demo to test the inferno palette from Matplotlib (https://matplotlib.org/stable/gallery/color/colormap_reference.html)
TBD: Make a procedural generation of ints array, because it looks sad.